
Most payroll teams automate the wrong things first. They'll spend months building automation for quarterly bonus calculations that run four times a year while manually fixing termination date mismatches every single week. The difference between successful payroll automation and expensive failures really comes down to one thing: knowing which exceptions eat the most time and money.
The teams that succeed don't automate based on what feels annoying or what a vendor is pushing. They build a prioritization model around three metrics that actually matter: exception volume, mean time to resolve (MTTR), and rework cost.
Exception volume tells you where the pain concentrates
Exception volume isn't just about counting errors. It's about understanding which payroll issues create cascading problems downstream. Take overtime calculation errors in retail. One miscalculation might affect only 8-12 employees per pay period, but each one triggers manual reviews, manager approvals, retroactive adjustments, and sometimes union grievances.
Compare that to missing direct deposit information for new hires. It happens more frequently – maybe 20-30 times per month in a 500-person company – but the fix takes two minutes. Grab the routing number, enter it, done. No downstream impact, no compliance risk, no angry employees threatening to quit because their overtime got shorted three weeks running.
The real exception volume calculation looks like this:
True Exception Impact = Base Occurrences × Downstream Tasks × People Involved
A timecard approval exception that happens 50 times per pay period but requires touching three systems and involves both HR and the employee's manager actually represents 150 operational touchpoints. That's your real volume number.
Here's what exception volumes typically look like for a 300-person company running biweekly payroll:
| Exception Type | Raw Count | Systems Touched | People Involved | True Volume |
|---|---|---|---|---|
| Missing timecard approvals | 45-55 | 3 | 2-3 | 270-495 |
| Tax withholding changes | 8-12 | 2 | 1 | 16-24 |
| Retroactive pay adjustments | 15-20 | 4 | 3 | 180-240 |
| New hire data incomplete | 10-15 | 2 | 2 | 40-60 |
| Garnishment processing | 3-5 | 3 | 2 | 18-30 |
Missing timecard approvals dominate everything else, even though retroactive adjustments feel more painful when they actually happen.
MTTR reveals your hidden time sinks
Mean time to resolve captures something volume misses: complexity. Some exceptions happen constantly but take thirty seconds to fix. Others happen rarely but consume entire afternoons.
Eliminate payroll errors and delays.
Payexly streamlines every payroll cycle ensuring accuracy and compliance.
- Automated payroll processing
- Real-time tax compliance
- Benefits & deductions management
No credit card required
I've watched payroll managers spend four hours untangling a single commission calculation error because it touched three different rate tables, two bonus structures, and a territory realignment from six months ago. That same manager fixed twelve PTO balance discrepancies in twenty minutes total that morning.
MTTR breaks down into distinct phases that most teams never bother measuring separately:
Detection time: How long before someone notices the exception? Investigation time: How long to understand what went wrong? Resolution time: How long to actually fix it? Verification time: How long to confirm the fix worked?
Missing direct deposit info gets detected instantly. Investigation takes zero time – the problem is obvious. Resolution takes two minutes. Verification happens automatically when payroll runs.
Commission calculation errors hide for weeks. Investigation requires pulling historical data from three systems. Resolution involves recalculating everything manually. Verification means waiting for the next commission run to confirm it processed correctly.
A realistic MTTR breakdown for common exceptions:
Quick fixes (under 10 minutes total):
-
Missing bank account details
-
Simple address updates
-
Basic tax form corrections
-
Standard PTO adjustments
Medium complexity (30-60 minutes):
-
Overtime recalculations
-
Multi-state tax adjustments
-
Garnishment modifications
-
Shift differential corrections
Time bombs (2-4 hours):
-
Commission structure errors
-
Retroactive rate changes across departments
-
Multi-period benefit reconciliations
-
Cross-border payroll adjustments
The problem with MTTR is that teams average everything together. A monthly MTTR of 45 minutes looks manageable until you realize it's hiding five four-hour disasters behind dozens of two-minute fixes.
Rework cost exposes the real damage
Rework cost goes beyond time spent fixing things. It includes the compound interest of mistakes: compliance penalties, employee trust erosion, and the opportunity cost of your best people doing manual cleanup instead of anything strategic.
Calculate rework cost using this framework:
Direct Labor Cost: Hours spent × loaded hourly rate of person fixing it
Compliance Risk Cost: Probability of audit finding × average penalty amount
Employee Impact Cost: Number of affected employees × productivity loss × average hourly rate
Opportunity Cost: What strategic project got delayed because someone spent all day fixing termination dates?
Take incorrect state tax withholding as an example. Direct labor might only run $47 per incident – one hour of a payroll specialist's time. But compliance risk averages $890 per incident when you factor in potential penalties. Employee impact adds around $220 when someone has to file amended returns. And opportunity cost? Your payroll manager couldn't review the new benefits integration that would've saved 8 hours per month.
Total rework cost: roughly $1,157 per incident, not $47.
Building your prioritization scoring model
The scoring model combines all three metrics into a single automation priority score. But straight multiplication doesn't work because it over-weights volume. A better formula:
Automation Priority Score = (Volume^0.7) × (MTTR^0.8) × (Rework Cost^0.5)
The exponents balance the factors so high-volume, low-impact tasks don't dominate your priority list.
Here's a worked example using real numbers from a 400-person professional services firm:
Timecard approval exceptions:
-
Volume
380 per month
-
MTTR
8 minutes
-
Rework cost
$32
-
Score
(380^0.7) × (8^0.8) × (32^0.5) = 69.4 × 5.3 × 5.7 = 2,095
Commission calculation errors:
-
Volume
12 per month
-
MTTR
180 minutes
-
Rework cost
$1,240
-
Score
(12^0.7) × (180^0.8) × (1240^0.5) = 6.4 × 65.8 × 35.2 = 14,818
PTO balance discrepancies:
-
Volume
145 per month
-
MTTR
6 minutes
-
Rework cost
$18
-
Score
(145^0.7) × (6^0.8) × (18^0.5) = 37.2 × 4.2 × 4.2 = 656
Commission calculations score 7x higher than timecard approvals despite happening 30x less frequently. That's your automation priority.
ROI calculators that actually reflect reality
Most payroll automation ROI calculators miss critical factors. They'll calculate time saved but ignore implementation effort, adoption friction, and maintenance overhead.
A realistic ROI calculation includes:
Benefits (Annual):
-
Labor hours saved × loaded hourly rate
-
Error reduction × average error cost
-
Compliance penalty avoidance
-
Employee satisfaction improvement (reduced turnover cost)
Costs (Total):
-
Software/development cost
-
Implementation hours × hourly rate
-
Training time × number of users × hourly rate
-
Annual maintenance (usually around 20% of implementation)
-
Process redesign effort
Hidden factors most calculators miss:
-
Adoption curve (assume roughly 40% adoption month 1, 70% by month 3, 85% by month 6)
-
Parallel running period (usually 2-3 months of double work)
-
Exception handling for edge cases the automation can't touch
Real ROI calculation example for automating retroactive pay adjustments:
Annual Benefits:
-
Labor savings
22 hours/month × 12 × $47 = $12,408
-
Error reduction
8 fewer errors/year × $1,100 = $8,800
-
Compliance improvement
~$3,200 estimated penalty avoidance
-
Total
$24,408
Year One Costs:
-
Software configuration
$8,500
-
Implementation
80 hours × $75 = $6,000
-
Training
12 people × 4 hours × $47 = $2,256
-
Parallel running
3 months × 50% extra effort = $1,551
-
Total
$18,307
Actual ROI timeline:
-
Month 1-3
Negative (implementation + parallel running)
-
Month 4-6
~$800/month benefit (partial adoption)
-
Month 7-12
~$2,034/month benefit (full adoption)
-
True Year 1 ROI
33%
-
Year 2 ROI
133% (benefits without implementation costs)
True Year 1 ROI: 33% Year 2 ROI: 133% (benefits without implementation costs)
Automation acceptance criteria that prevent expensive failures
Before automating any payroll exception, run it through these acceptance tests. Skip them and you'll build automation that nobody uses or that creates more problems than it solves.
Test 1: Consistency threshold Can you handle 85% of cases with the same logic?
Test 2: Data availability Is all required data in accessible systems?
Test 3: Downstream readiness Can downstream processes handle automated input?
Test 4: Rollback capability Can you undo the automation if something goes wrong?
Payroll governance frameworks should include rollback procedures. If an automated retroactive adjustment processes incorrectly, can you reverse it before payroll runs? Without rollback capability, automation becomes a liability.
Test 5: Exception handling What happens when the automation hits something unexpected?
Good automation handles 85% of cases automatically, flags 10% for review, and clearly fails on the remaining 5% rather than processing them incorrectly.
Sample metrics to guide your automation sequence
Based on data from roughly 40 mid-market companies, here's what successful payroll automation prioritization typically reveals:
High-impact automations (implement first):
-
Multi-state tax calculations Volume
40-60 per pay period MTTR: 35-45 minutes per exception Rework cost: $400-1,800 per error Priority score: 8,000-12,000
-
Retroactive rate adjustments Volume
20-30 per pay period MTTR: 60-90 minutes per exception Rework cost: $300-900 per error Priority score: 6,000-9,000
-
Garnishment calculations Volume
25-40 per pay period MTTR: 25-40 minutes per exception Rework cost: $800-2,400 per error (high compliance risk) Priority score: 5,500-8,500
Medium-impact automations (implement second wave):
-
Overtime and shift differentials Volume
120-180 per pay period MTTR: 8-12 minutes per exception Rework cost: $45-120 per error Priority score: 2,000-3,500
-
PTO accrual adjustments Volume
80-120 per pay period MTTR: 5-8 minutes per exception Rework cost: $25-60 per error Priority score: 1,200-2,000
Low-impact automations (probably not worth it):
-
Address updates Volume
60-90 per month MTTR: 2-3 minutes per exception Rework cost: $8-15 per error Priority score: 200-400
-
Emergency contact updates Volume
40-60 per month MTTR: 1-2 minutes per exception Rework cost: $5-10 per error Priority score: 100-200
These numbers won't match your situation exactly, but the spread between categories tends to hold pretty consistently. High-impact exceptions almost always score an order of magnitude above the low-impact ones once you factor in all three variables.
The acceptance testing checklist
Run every potential automation through this checklist before committing resources:
Data quality gates:
-
Source data accuracy exceeds 95%
-
All required fields consistently populated
-
Historical data available for testing (minimum 6 months)
-
Data refresh frequency matches processing needs
Process maturity indicators:
-
Written procedures exist for the manual process
-
Same process used across all departments/locations
-
Exception handling already documented
-
Clear escalation path defined
Technical feasibility markers:
-
APIs or data exports available from all systems
-
Test environment accessible
-
Rollback procedures documented
-
Error logging and alerting capability exists
Organizational readiness signals:
-
Process owner identified and committed
-
End users consulted and bought in
-
Training materials drafted
-
Success metrics defined and measurable
Risk mitigation requirements:
-
Parallel running period planned
-
Manual override capability preserved
-
Audit trail requirements met
-
Validation checks incorporated
Run every potential automation through this checklist before committing resources:
When automation makes things worse
Not every high-scoring exception should be automated. Sometimes the manual process, inefficient as it is, serves purposes that automation quietly eliminates.
Commission dispute resolution often falls into this category. The manual review process, annoying as it is, forces sales managers to actually look at their team's compensation. They catch territory assignment errors, notice unusual patterns, and have real conversations about performance. Automate it completely and those errors compound for months before blowing up into something much harder to fix.
New hire data collection can be similar. Yes, an automated form could collect emergency contacts, tax withholding preferences, and direct deposit information. But the HR conversation during onboarding builds relationships, surfaces concerns, and makes sure people actually understand their benefit elections.
The key question is whether the manual process creates value beyond just completing the transaction. If it does, think carefully before eliminating it entirely.
Moving from model to implementation
Once you've scored and prioritized your exceptions, implementation sequence matters as much as individual automation quality. Here's the rollout pattern that tends to work:
Phase 1 (Months 1-3): Foundation Pick one high-scoring exception that affects a single department. Get it working well. Use it as your proof of concept and learning lab. Document everything that goes wrong – it'll matter later.
Phase 2 (Months 4-6): Expansion Add 2-3 more exceptions from your high-priority list. Focus on variety – different calculation types, different data sources, different user groups. You're stress-testing your automation framework.
Phase 3 (Months 7-9): Acceleration Now you can move faster. Add 5-8 medium-priority exceptions. By this point you've learned the common patterns and pitfalls, and your team knows the tools.
Phase 4 (Months 10-12): Optimization Circle back to your initial automations. What edge cases have emerged? Which manual overrides happen most often? Refine the logic and expand coverage.
Payroll exception automation rollout timeline visualization:
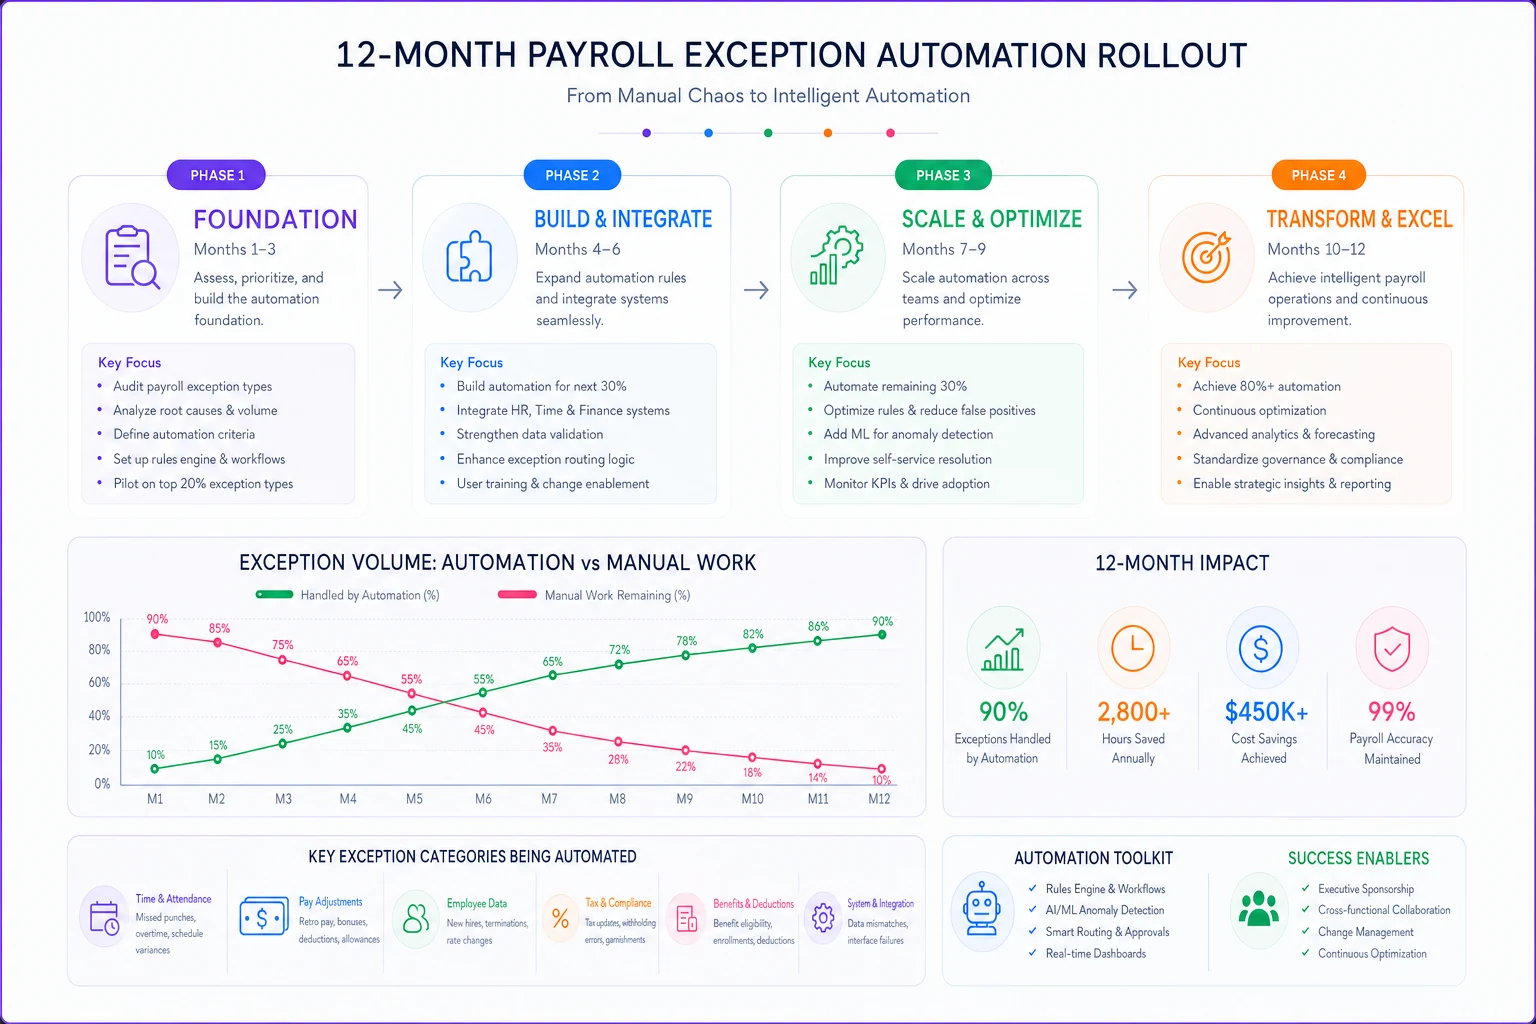
Phase 1-4 timeline shown above illustrates expected automation adoption and manual workload reduction over 12 months.
The compound effect of systematic automation
Payroll departments that follow this prioritization model tend to see an interesting shift happen around month eight or nine. The time saved from high-priority automations creates bandwidth for process improvements they never had time for before. Teams start catching errors before they happen instead of cleaning them up afterward.
One distribution company automated their multi-state tax calculations first – their highest-scoring exception. The 30 hours per month they recovered went into building better pre-filing validations. Those validations caught overtime calculation errors before they hit payroll. The prevented errors freed up more time for improving their garnishment processes.
After a year, they weren't just processing payroll faster. Errors that used to cascade across three pay periods were getting caught and corrected the same day.
This is where AI-powered operational software changes what's possible. Instead of hard-coding every rule, modern platforms learn from your exception patterns – identifying which errors cluster together, which fixes tend to work, and which edge cases consistently need human review. The prioritization model tells you where to start, but AI automation helps you scale well beyond what traditional rule-based systems can handle.
Making the model work for your organization
Your exception volumes, MTTR, and rework costs won't match the examples here exactly. That's fine. The model's value isn't in the specific numbers – it's in forcing you to measure what actually matters.
Start by tracking just one month of exceptions. Don't aim for perfect data. Approximate MTTR is better than no MTTR. Use salary estimates for rework costs if you don't have precise figures. The relative scores matter more than absolute accuracy.
Start by tracking just one month of exceptions.
Most importantly, revisit your prioritization every quarter. Exception patterns change as your business grows, your workforce shifts, and your processes mature. The retroactive adjustments that are killing you today might disappear entirely once you fix the upstream timecard approval process.
The companies that actually succeed with payroll automation don't automate everything. They automate the right things in the right order, measure the actual impact, and adjust based on what they learn. The prioritization model just gives you a framework for making those decisions with data instead of gut instinct.
The companies that actually succeed with payroll automation don't automate everything. They automate the right things in the right order, measure the actual impact, and adjust based on what they learn. The prioritization model just gives you a framework for making those decisions with data instead of gut instinct.
Ready to simplify your payroll operations?
Join 2,000+ businesses using Payexly to reduce payroll overhead, ensure compliance, and enhance employee satisfaction.