


Every payroll cycle, your HR team pulls employee data from one system while finance downloads transaction reports from another. Meanwhile, your operations manager is building spreadsheets trying to connect labor costs to department budgets. Three teams, three different data views, zero consistency.
This disconnection costs more than just time. When a manufacturing company I worked with finally mapped their payroll data flows, they found HR and finance had been reporting different headcount numbers to the board for six months. HR showed 142 employees based on active profiles in their HRIS. Finance counted 138 based on payroll transactions. The actual number was 145, including three contractors miscategorized in both systems.
Nobody was wrong, exactly. Both departments were working correctly from their own data sources. But without a canonical payroll data strategy—a single, standardized way to structure and interpret payroll information—every department ends up operating in its own version of reality.
Understanding canonical data models in payroll operations
A canonical payroll data model creates a shared language for payroll information across your organization. Think of it as a master blueprint that defines what each data field means, where it comes from, and how different departments should interpret it.
Most businesses accumulate payroll data chaos gradually. You start with basic payroll software. HR adds their own system for benefits. Finance implements new GL codes. Operations creates department-specific reports. Each addition makes sense on its own, but collectively you end up with what I call "data dialects"—the same information described differently depending on who's asking.
Take something as basic as overtime hours. Your payroll system might track it as OTHOURS. HR's system calls it OVERTIMEWORKED. Finance maps it to GL account 5120. Operations knows it as "weekly OT variance." Four names for the same data point, often with slightly different calculation methods behind each one.
A canonical model eliminates these inconsistencies by establishing authoritative field definitions. Every system either adopts those definitions directly or maps to them through clear translation rules. No more guessing whether "total compensation" includes employer-paid benefits, or whether "active employees" counts people on unpaid leave.
Field-level mapping architecture that actually works
Building effective field mappings requires understanding how data moves through your payroll ecosystem. Most businesses have at least four core data streams: employee master data, time and attendance, payroll calculations, and GL posting data. Each stream contains dozens of fields that need precise mapping.
Eliminate payroll errors and delays.
Payexly streamlines every payroll cycle ensuring accuracy and compliance.
- Automated payroll processing
- Real-time tax compliance
- Benefits & deductions management
No credit card required
Start with employee master data. A typical mid-size company might have 60–80 core fields spread across multiple systems. Your HRIS holds demographic data, employment terms, and benefits elections. Payroll software tracks tax withholdings, direct deposit info, and year-to-date totals. Time systems capture hours worked, PTO balances, and scheduling data.
The mapping challenge is field incompatibility. Your HRIS might store employee status as "Active/Inactive/Leave." Payroll uses "Current/Terminated/LOA/Suspended." Finance needs "Billable/Non-billable/Overhead." Without canonical definitions, someone manually translates between these formats every reporting period—usually inconsistently.
A practical mapping structure for core employee fields:
| Source System | Source Field | Canonical Field | Data Type | Validation Rules |
|---|---|---|---|---|
| HRIS | EMP_STATUS | EMPLOYEE_STATUS | String | Must match: ACTIVE, TERMINATED, LEAVE, SUSPENDED |
| Payroll | PAY_FREQUENCY | PAY_CYCLE | String | Must match: WEEKLY, BIWEEKLY, SEMIMONTHLY, MONTHLY |
| Time System | DEPT_CODE | COST_CENTER | String | Must match GL structure: XXXX-XXX |
| HRIS | HIRE_DATE | EMPLOYMENT_START | Date | Format: YYYY-MM-DD |
| Payroll | FED_FILING | TAX_STATUS | String | Must match: SINGLE, MARRIED, HEAD |
Start with the 60–80 core employee fields most used across systems to get early value.
Each mapping includes transformation logic. When HRIS sends "Leave," it converts to canonical status "LEAVE." When finance pulls reports, "LEAVE" employees get excluded from billable headcount but included in benefits costs. Everyone works from the same definitions, and the translation happens once instead of repeatedly and inconsistently across teams.
Prioritizing KPIs for HR versus finance perspectives
HR and finance care about fundamentally different things, even when looking at the same payroll numbers. This isn't really a communication problem—it's a perspective problem that your canonical model needs to accommodate.
HR focuses on workforce metrics that indicate organizational health: turnover rates, compensation equity, overtime trends, benefits utilization. Their KPIs answer questions about talent retention, compliance risk, and workforce productivity. A 5% increase in overtime might signal understaffing to HR.
Finance sees the same overtime increase and analyzes margin impact and forecast variance. They're monitoring labor as a percentage of revenue, payroll variance to budget, tax liability accuracy, and accrual precision. Same number, completely different frame.
Your canonical model needs to serve both without forcing either team to abandon how they naturally think about the business. That means structuring data to support multiple calculation methods from the same source fields.
Both teams analyzing overtime from the same canonical OVERTIME_HOURS field might look like this:
HR's Overtime Analysis:
-
Average OT hours per employee
-
Departments exceeding 10% OT threshold
-
Employees working 50+ hours consistently
-
Correlation with turnover rates
Finance's Overtime Analysis:
-
OT premium cost impact
-
Budget variance by cost center
-
Quarter-over-quarter OT trends
-
Impact on gross margin
HR divides by active headcount. Finance multiplies by premium rates. Neither calculation is wrong—they answer different questions.
Implementation priority should reflect your actual business. For a professional services firm where labor is 65% of revenue, finance KPIs around utilization and margin come first. For a retail chain with chronic turnover problems, HR metrics around retention and scheduling matter more.
Building reconciliation automation that catches discrepancies
Manual reconciliation between payroll, HR, and GL systems catches maybe 70% of discrepancies if you're lucky. The rest surface during audits, tax filings, or when someone notices their department headcount looks off.
A canonical model enables automated reconciliation by establishing clear matching rules. Instead of comparing raw data across systems—which never matches perfectly due to formatting and timing differences—you compare canonical transformations that should align.
A regional healthcare provider had chronic reconciliation problems between payroll and GL. Every pay period, their accounting team spent two days matching transactions and usually found 15–20 discrepancies. After implementing canonical reconciliation rules, they automated roughly 90% of the matching process. Discrepancies dropped to 2–3 per period, mostly legitimate timing differences.
Their reconciliation logic followed this pattern:
-
Source Data Collection - Pull payroll register from payroll system - Extract GL entries from finance system - Download timesheet data from time system
-
Canonical Transformation - Convert all employee IDs to canonical format - Map department codes to cost centers - Standardize pay component categories
-
Three-Way Match Rules - Gross pay in payroll = time system hours × rates - Net pay in payroll = GL cash disbursements - Payroll taxes = GL tax liability accounts
-
Variance Investigation - Flag variances exceeding $100 or 1% - Group variances by pattern (department, pay type) - Generate investigation priority based on magnitude
The automation doesn't eliminate human review. It changes what humans are doing—from hunting for problems to investigating specific pre-identified variances. That's a much better use of your accounting team's time.
Dashboard wireframes that bridge department silos
Traditional payroll dashboards fail because they're built for one department. HR gets their metrics. Finance gets different ones. Nobody sees the complete picture of how payroll connects to business operations.
A canonical data strategy lets you build unified dashboards that adapt to the viewer while keeping the underlying data consistent. Same source, different views.
Layer 1: Executive Overview Consolidated metrics both departments care about—total labor cost, headcount trends, budget variance. Drill-down capability lets executives explore department-specific views without needing separate reports.
Layer 2: Department Views HR sees workforce analytics: employee lifecycle metrics, compensation analysis, compliance indicators. Finance sees cost breakdowns, variance analysis, forecast accuracy. Both views pull from the same canonical data but emphasize different calculations.
Layer 3: Operational Detail Managers access team-specific data. A warehouse manager sees overtime trends for their shift workers. A sales director views commission calculations. Each operational view inherits canonical definitions but filters to relevant scope.
The main goal is preventing dashboard proliferation. Without canonical structure, every department builds their own reports and you end up with dozens of spreadsheets all claiming to show "real" payroll metrics. Canonical dashboards replace that chaos with authoritative, role-appropriate views.
Practical wireframe structure for a unified payroll dashboard:
Top Navigation Bar:
-
View selector (Executive | HR | Finance | My Team)
-
Date range selector
-
Refresh indicator showing last data sync
Main Grid Layout (Executive View):
-
Top row
KPI cards (Headcount | Labor Cost | Cost per FTE | Overtime %)
-
Middle row
Trend charts (12-month headcount | YTD labor cost | Budget variance)
-
Bottom row
Department breakdown table with drill-down capability
HR-Specific Elements:
-
Turnover analysis widget
-
Compensation distribution chart
-
Benefits enrollment tracker
-
Compliance alert panel
Finance-Specific Elements:
-
GL reconciliation status
-
Variance analysis table
-
Accrual calculations
-
Tax liability summary
Each element pulls from canonical fields but applies view-specific business logic. HR's "turnover rate" calculation uses canonical TERMINATIONDATE and EMPLOYEESTATUS fields. Finance's "accrued PTO liability" uses those same fields plus HOURLYRATE and PTOBALANCE.
Implementation roadmap: From chaos to canonical
Month 1: Discovery and Documentation Map your current state before designing anything. Document every system touching payroll data, every report stakeholders actually use, and every manual process filling gaps between systems.
A construction company I guided through this discovered they had 14 systems with payroll data. Not just the obvious ones—also project management tools tracking labor hours, safety systems with worker certifications, and equipment databases linking operators to machines. Each became a data source for their canonical model.
During discovery, focus on data flows rather than system features. Track how employee data enters each system, what transformations happen, and where it gets exported. You'll find redundant data entry, conflicting updates, and manual processes everyone forgot existed.
Month 2: Canonical Design Define canonical fields based on actual business needs. Start with core employee and payroll fields that multiple departments use. Add specialized fields only when clear use cases exist.
Avoid trying to canonicalize everything at once. One company mapped all 400+ fields from their HRIS into the canonical model. Three months later, they realized only around 60 fields actually needed canonical definitions. The rest were system-specific and rarely accessed by anyone outside that system.
Your canonical design should include:
-
Field definitions with business names and technical specifications
-
Source system mapping showing where authoritative data lives
-
Transformation rules converting source data to canonical format
-
Validation rules ensuring data quality
-
Access controls determining who can modify canonical definitions
Month 3: Technical Implementation Build the infrastructure for canonical data flow—data warehouse setup, API development, ETL pipelines, whatever fits your environment. The specific technology matters less than consistent execution.
Most organizations underestimate data quality issues at this stage. That "simple" employee ID field might have leading zeros in one system, hyphens in another, and completely different formats for contractors. Build transformation logic that handles edge cases, because there will be a lot of them.
Test with historical data before going live. Run parallel processes comparing canonical outputs to existing reports. You'll find mismatches—investigate each one. Sometimes the canonical logic needs adjustment. Sometimes you discover the old reports were just wrong.
A visual workflow helps coordinate these stages.
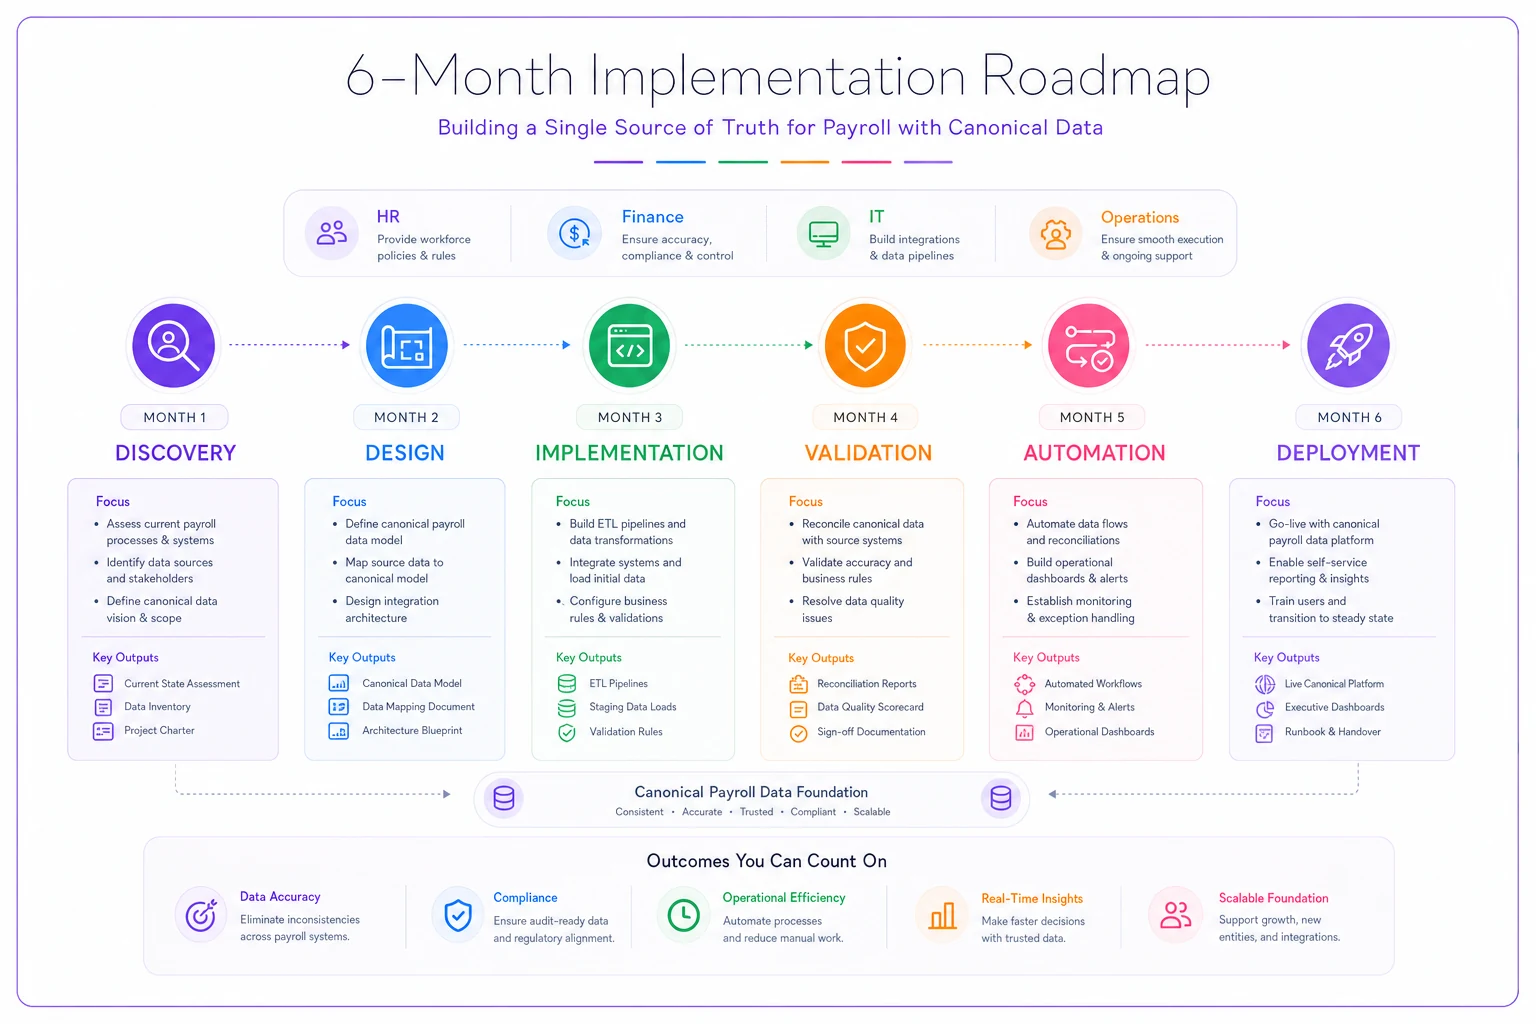
Use this as a reference while planning.
Month 4: Stakeholder Validation Deploy canonical reports alongside existing ones. Let stakeholders compare outputs and raise concerns. This parallel run builds confidence while catching issues before they matter.
Finance might notice their labor accruals calculate differently using canonical data. Investigation reveals they were excluding terminated employees who still had final paychecks pending. The canonical model correctly includes them. That's not a bug—it's fixing a longstanding error.
Create translation guides showing how old metrics map to canonical ones. When HR asks why headcount changed, point to the canonical definition that includes all active employees, not just full-time ones. These clarifications matter more than people expect.
Month 5: Automation Integration Connect canonical data to automated processes. Reconciliation scripts run against canonical fields. Dashboards pull from canonical views. Alert systems monitor canonical thresholds.
Automation tends to surface remaining data quality issues quickly. A reconciliation routine fails because five employees have duplicate records across systems. The dashboard shows negative overtime because time clock adjustments aren't mapping correctly. Each failure improves the model.
Start with read-only automation before enabling write-back. Let systems consume canonical data before they start updating it. Staged approach, lower risk.
Month 6: Full Deployment Retire legacy reports and processes. The canonical model becomes the authoritative source for payroll data.
That doesn't mean perfection. You'll still have exceptions, special cases, and occasional manual overrides. But now they happen within a controlled framework instead of ad-hoc chaos.
ROI calculation framework for canonical payroll data
The business case goes beyond efficiency. Time savings matter, but the real value comes from avoided errors, better decisions, and reduced compliance risk.
A distribution company with around 300 employees calculated their canonical implementation ROI after one year. They initially justified the project on labor savings—eliminating roughly 20 hours weekly of manual reconciliation and report preparation. At $50/hour fully loaded cost, that's around $52,000 in annual savings. Decent, but not transformative.
The actual benefits exceeded that significantly:
Error Reduction: Pre-canonical, they averaged two payroll errors per period requiring corrections. Each took about 3 hours to investigate and fix, plus employee relations friction. Post-canonical, errors dropped to under one per month. Annual labor savings around $9,000, plus morale improvements that are harder to put a number on.
Audit Preparation: Year-end audit previously required 80 hours gathering documentation across systems. With canonical data, that dropped to 25 hours. The auditors noted the organization, which may reduce future audit fees.
Decision Speed: Department managers previously waited 3–5 days after payroll for accurate labor reports. Canonical dashboards provide near-real-time data. One manager caught a scheduling problem driving overtime and saved roughly $2,800 monthly once corrected.
Compliance Confidence: Standardized data eliminated gray areas in overtime calculation and tax reporting. Reduced risk of Department of Labor violations or tax penalties is real value, even if it's hard to quantify until something goes wrong.
Total first-year benefits exceeded $120,000 against implementation costs around $75,000—and that excludes the improvements in decision-making quality and risk reduction that don't show up cleanly in a spreadsheet.
Common pitfalls and how to avoid them
Every canonical implementation hits predictable problems. Knowing them in advance helps you either avoid them or at least not be surprised.
Pitfall 1: Over-Engineering the Model Technical teams love comprehensive solutions. They'll design canonical models handling every possible scenario, with complex inheritance hierarchies and abstract data types. Meanwhile, the business just needs consistent employee counts.
Keep canonical definitions as simple as business requirements allow. That employee status field doesn't need 15 values if the business only cares about active versus inactive. Add complexity when you actually need it.
Pitfall 2: Ignoring Political Realities Department heads get territorial about their data. HR owns employee information. Finance owns cost data. Operations owns productivity metrics. A canonical model challenges those boundaries.
Build coalition support before implementation. Show each department how canonical data helps them without dismissing their expertise. HR still defines employment policies—the canonical model just ensures consistent application. Finance still owns budgets—canonical data makes them more accurate.
Pitfall 3: Underestimating Data Quality Issues That payroll system running since 2008 has accumulated years of workarounds, special cases, and undocumented business rules. Your canonical model will surface all of it.
Budget significant time for data cleanup. Create exception handling for historical anomalies you can't easily fix. Document everything you find—these discoveries often reveal process improvements that go well beyond data management.
Pitfall 4: Weak Change Management Canonical models change how people work. The accounting clerk who's run the same reconciliation for five years now needs to learn new processes. Resistance is natural and predictable.
Invest in training and communication. Show affected staff how canonical data makes their jobs easier. Celebrate early wins. Make champions out of early adopters—their credibility with peers matters more than any top-down directive.
When canonical payroll data transforms operations
The real value of canonical payroll data shows up when it becomes embedded in operations, not just reporting. Instead of fixing data problems after they occur, the canonical structure prevents a lot of them from happening in the first place.
A professional services firm discovered this about six months into running their canonical model. Initially focused on reporting consistency, they gradually realized the structure enabled things they hadn't originally planned for.
Project managers started using canonical labor cost data for real-time project margin analysis. Previously, they waited for monthly reports from finance and often discovered projects went underwater weeks earlier than they found out. With canonical data, they could see margin erosion immediately and adjust resources before the damage compounded.
HR leveraged canonical definitions to automate compliance monitoring—automatically flagging when non-exempt employees approach overtime thresholds, when departments exceed contractor percentage limits, when pay equity gaps emerge. Issues that previously required someone to specifically look for them now generated proactive alerts.
The usefulness extended beyond internal operations. When evaluating acquisition targets, they mapped prospect payroll data to their canonical model during due diligence. That revealed integration complexity and cost synergies with a precision that traditional spreadsheet analysis couldn't match.
There's also a practical benefit when it comes to AI-powered operational software: these tools work significantly better when your data follows consistent structure. Automated systems can detect patterns, flag anomalies, and surface recommendations when payroll data is clean and canonical. When every department defines overtime differently, you can't build reliable automation on top of it—the data foundation matters.
As the business grows, the canonical model scales with it. New locations adopt established definitions. Acquired companies map to existing structure. Additional systems integrate through standard interfaces. What starts as a data project becomes operational infrastructure.
Building your canonical payroll data strategy
Canonical payroll data isn't about perfection. It's about consistency and clarity across your organization. Every business has unique requirements, legacy systems, and political dynamics that shape their canonical model. The key is starting with clear business objectives, not technical elegance.
Focus on the highest-impact data elements first. Get employee counts consistent between HR and finance before worrying about equipment allocation codes. Build stakeholder trust through small wins before tackling contentious definitions. Accept that some data will stay outside the canonical model, at least initially.
Canonical models also evolve. Your initial implementation won't anticipate every scenario—new regulations require additional fields, business strategy shifts demand different metrics. Build flexibility in so that evolution doesn't require starting over.
The investment pays dividends well beyond clean reports. Operations run smoother when departments share a common language. Decisions happen faster with trusted data. The chaos of disconnected payroll data isn't inevitable—it's a choice to accept or fix.
Ready to simplify your payroll operations?
Join 2,000+ businesses using Payexly to reduce payroll overhead, ensure compliance, and enhance employee satisfaction.